

But you decide for yourself.
Let's start with precipitation. The past two weeks? Above normal for the entire state, and HUGELY above normal over the Cascades and western Washington.

But drought might reflect the total winter precipitation so far you might argue. Reasonable. So here is the precipitation for the past two months. Nearly the entire state is still above normal, except for some small areas in eastern WA that are minimally below normal. We have been wetter than normal.

What about the famous Palmer Drought Severity Index, an objective measure of long-term drought, encompassing both precipitation and temperature. No drought indicated and very wet conditions over western WA and Oregon.


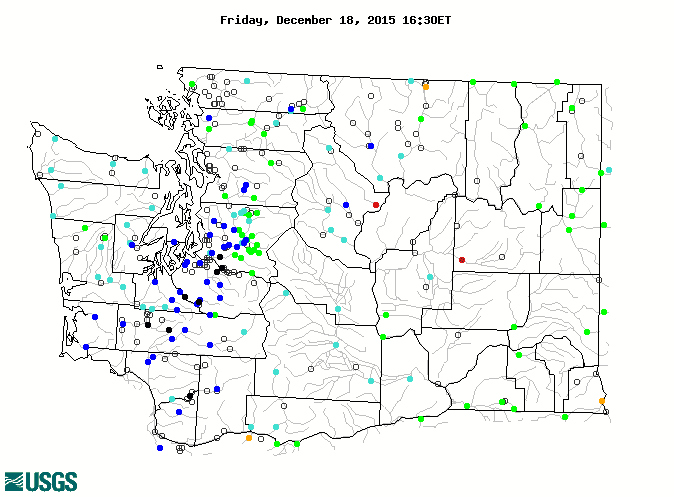
What about snowpack? There have been lots of scary stores about snow droughts for this winter and the like. Most of the state has either near normal or above normal snowpack now, except a small portion of the western slopes of the Cascades. There is no snow drought right now.

NOAA has an OBJECTIVE blend of short-term drought indicators (see below). No drought.

What about the critical reservoirs of the Yakima River Basin, which supports a huge amount of agriculture in eastern WA? As shown below, WAY above normal.

It seems to me that saying that any portion of Washington State is in drought is inaccurate. Some groups are paradoxically calling this a wet drought. Sort of like calling someone a thin fat person. Some advocacy groups are using this term and claiming it may be a sign of global climate change.

This is not unlike some folks that were claiming that cold waves in the East Coast were the result of global warming. Global warming is a serious issue and advocacy group antics with wet droughts and global warming fueled cold waves are not helping. They detract from scientific credibility.
And this week I experienced the negative effects of Drought Monitor hype on scientific work.
For the past several days, I have been at the American Geophysical Association (AGU) meeting and I have attended several sessions dealing with drought and hydrology. One presentation attempted to verify their hydrological model against the official U.S. Drought Monitor, but found their objective model was much wetter. You can guess why this is true. The Drought Monitor exaggerates drought and does not pull areas from drought status fast enough. And it is subjective and includes impacts.
GOOD NEWS ON KPLU
The University of Washington and Pacific Lutheran University have agreed to allow the community a chance to collect the funds needed to make KPLU an independen public radio station. They listened to the vast KPLU listenership, which was dismayed that a successful and valued local news and music outlet was being dismantled without public input.
There has been a lot of press coverage of this of late and detailed information at: savekplu.org
Many of you are interested in contributing to building an independent KPLU. It will take at least a few weeks before the mechanisms to do so are established, but in the meantime it would be very useful if you could express you interest in making a contribution and, if comfortable, estimate your future gift, by sending an email with the information to:
Grace Lynn Scott, KPLU's Gifts Coordinator at gracelynn@kplu.org
You can call her as well.


As you show well, there are no current conditions that justify a drought call for our region right now. The drought index has become a proxy for concerns about future (next growing season) water supply, which, for snow-pack dependent areas like the Yakima won't be known for certain until late spring. Calling it a drought allows access to specific funding sources and accelerated permitting processes. It might seem less strange if we used a water supply forecast as our planning tool, one that incorporates probabilistic forecasts of future water conditions. Luckily there is at lease one such tool, NOAA's. It combines actual conditions to date with the future 10 day forecast and a range of estimates of future conditions based on the historic record, and shows how the prediction changes over the season. Here's the one for next irrigation season for the Yakima:
ReplyDeletehttp://www.nwrfc.noaa.gov/water_supply/ws_forecasts.php?id=PARW1
Pretty encouraging to see how the predicted water supply has improved with each storm we've had in December, and far more informative about next season's water supply than simply showing the current reservoir contents (which last year didn't drop below average until June 1st). Here's a nice graph of how the NOAA Forcast changed over time last year:
http://www.nwrfc.noaa.gov/water_supply/ws_archive.cgi?id=PARW1&wy=2015
Watching this you would have started preparing for a short water year in January, not June... Glad it looks different so far this year!
Alright, I can't help myself- here's a nice example of the opposite case from last year, from 2014, when a wonderful series of February snowstorms turned the water supply forecast for the Yakima from below to above average:
ReplyDeletehttp://www.nwrfc.noaa.gov/water_supply/ws_archive.cgi?id=PARW1&wy=2014
This was a terrific help to me in forming a comprehensive view of our drought (or not) situation.
ReplyDeleteCan I persuade you to do something similar for California?
Good stuff here. But does anybody know why the hell it keeps raining and snowing? Yes I know that here in Washington it was way too dry the last two winters, but come on, Snoqualmie is almost 200% of normal for December and we still have over a week left for any more storms. It feels like La Nina to me, but NOAA and everybody else keep saying it is El Nino, but if that is true, clearly the El Nino waters are not having the normal effect up here. I don't like drought, but there does come a point when enough is enough. All the folks effected by this constant nonsense: Closed roads, floods, ice, etc. I feel NOAA is giving failed outlooks, I mean for 3 months in a row they have said AN temps, BN precip, but this is not true, not one bit. What models are they using because these models are clearly wrong.
ReplyDeleteI'm not sure we're totally out of the woods. Soil moisture in our area is good right now, but what about aquifers? Many of us in rural areas depend on wells, not water behind dams or what's in nearby streams and rivers.
ReplyDeleteTo recharge our aquifers, we depend on snow in the mountains that slowly releases moisture as it melts. We have lost a lot of this resource because of global warming. They're predicting that the older snow in the Cascades will disappear. The high mountain meadows that used to have a brief summer, measured in just weeks, will now be exposed to too much sun and warmth.
May be a wet drought still. How are the aquifers? I believe a major one in California is GONE. Fossil water that had been there since before the arrival of Europeans has been pumped dry.
Yes, I'm a little disappointed in Drought Monitor too. I could sort of understand it's drought call for western Washington in November. After the heavy rains, the puddles very quickly sank away. I assume because the deep soil was dry. So maybe if Drought Monitor tracks deep soil moisture its call was not as off-base as it appeared.
ReplyDeleteNow December, the forest puddles are persisting, water ran over Wax Orchard road and the seasonal ponds are filled. Now the soils are saturated.
Monthly rainfall for South Vashon Island:
October: 5.18
November: 9.02
As of December 19: 9.78
Total 23.98 inches.
There are additional factors that could be included in drought monitoring such as evaporation and transpiration. In eastern Colorado, several feet of water evaporates from surface reservoirs during the summer months. Deep reservoirs are more efficient for water storage than shallow ones.
If the air is much warmer and dryer than normal than normal rainfall can leave native vegetation dry, melt more glacial ice and draw down lakes and ponds.
Conversely, if the air is cooler and wetter than normal than below normal rainfall can be sufficient, add glacial ice and maintain lakes and ponds
So I don't believe monitoring rainfall totals alone is sufficient.
I believe that little tiny yellow "below normal" spot in extreme SE corner of the state corresponds to the Red Mountain wine region, which is normally drier and hotter than the rest of the state. It produces some great red wines.
ReplyDeleteWhat do the farmers say?
ReplyDeleteHow anyone who follows actual data believes any of the drought proclamations in our region anymore is beyond me.
ReplyDeleteWe finished the water year (Oct 1 '14 to Oct 1 '15) at 100% precip in Seattle, never went below 90% all year (in fact spent much of it >100%), and yet we heard there was a drought virtually every day (beginning in February) and it was going to get worse. By mid-summer some were proposing we "water shame" our neighbors. Truly a low point for our community for this reader as SPU never once went beyond suggesting voluntary reductions and was consistently honest about the quantity of water in the reservoirs.
And it wouldn't end there. It would continue into the fall (Fall and Winter Forecast: Warm and Dry Across the Northwest - Seattle Times 9/23/15) and you could find similar articles circulating from virtually every major news outlet.
And yet SPU finished the water year on Oct. 1 with 10 billion gallons in the reservoirs. Actually, that was 10 billion gallons above the low reservoir level, which itself is 10 billion gallons. So make that 20 billion gallons (today at 40 billion). Seattle will finish the calendar year with another 40+ inch precip year and be well on our way to once again boosting the NOAA 10-year average for our region (as happened from 2000 to 2010). (Current 5-year avg 41"+, well over the running 37.5" avg).
And Cliff Mass's blog was the only place - the only place all year long - one could find truth on the subject. Still is. Why is that?
The "Drought Monitor" will probably subjectively respond to Cliff's call here, and remove the WA drought in a few weeks.
ReplyDeleteTheir site doubles their "cry wolf" by also claiming --"Estimated Population in Drought Areas: 1,348,084". While their disclaimer notes the precise borders are estimates of area affected, adding a grossly inaccurate population total only compounds their mistake.
ReplyDeleteCliff - your readers should know that you aren't telling the whole story. Here at the University of Washington we have analytic drought monitors that are publicly available and are updated in near real time. Products like these (links below) are used to help create the Drought Monitor, and at least for today, do indicate that the total moisture storage is below normal in portions of Eastern Washington. Since you are pushing for more analytic drought measures, might I suggest a blog post looking at the ones that are already in existence?
ReplyDeleteLinks:
- UW West Drought Monitor: http://hydro.washington.edu/forecast/monitor_cali/index.shtml
- UW Surface Water Monitor: http://www.hydro.washington.edu/forecast/monitor/index.shtml
Joe,
ReplyDeleteI have to disagree. I know all about the UW drought monitor and have talked to Bart Njissen, the director of the effort, about it. First, this is not an observed data set...it is a combined model/obs assimilation system. It shows that most of eastern WA is not in drought. Importantly, there is clearly some major problems with this system...such as the drought indicated on the extraordinarily wet western slopes of the NW Cascades...cliff
This is what happens when government uses science to promote its own ends. Citizens might think that NOAA and the rest of the federal shops that make up the "U.S. Drought Monitor" are bastions of science and will not make pronouncements strictly to enable the civilian leadership's political agenda. They would be wrong. Kudos again Cliff, for showing us the man behind the curtain.
ReplyDeleteI don't think Cliff is seeking to expose a political agenda, Michael, but rather a potentially outdated and flawed drought forecasting system.
ReplyDeleteCliff, the main thing you have not shown here is the objective LONG-TERM blend: http://www.cpc.ncep.noaa.gov/products/predictions/tools/edb/lbfinal.gif
ReplyDeleteHave a look at the western formulation and you will see why WA is still in drought, according to the USDM. You seem to be focusing on the current water year, and I would agree that for the start of this water year WA is not in drought. Long-term (2-5 years) conditions of temp and precip tell a different story. Whether the long-term conditions are an appropriate metric for the entire western US could surely be debated, but you need to provide your readers the entire USDM story.
Dan McEvoy
Western Regional Climate Center
Dan... I just looked at the graphic you noted...eastern WA is white. NO DROUGHT..cliff
ReplyDeleteGreat column, as usual! Is there "Big Ag" money behind pronouncements of current or anticipated future drought? The "mainstream" media does such a poor job with climate/weather reporting--every weather story has to be accompanied by a "climate change" line or two, which doesn't help the scientific community try to increase understanding of climate change among the general public, but actually undermines it. The average citizen these days seems to have less knowledge about short- and long-term climate cycles than they did 20 years ago. Interestingly, salmon runs are great indicators of cycles that affect ocean temperatures and currents. It's one of the main reason it requires incredibly long periods of site-specific monitoring to assess whether habitat improvement and restoration efforts have an effect on survival.
ReplyDeleteCliff, I have bit broader question. I understand your reluctance to call what appear to be weather changes in temperature and precipitation, a function of Global Warming, specifically on the local level as we've experienced this past year. And I also understand your position that what we saw this past year is a taste of what is come in another 50 years.
ReplyDeleteHowever, I am having trouble reconciling this with the current melting of Greenland ice, Alaskan Glaciers, our glaciers, the arctic, and Antarctica, along with the rising sea that is flooding islands in the South Pacific.
Could you please comment on this. If you already have, I apologize but would appreciate a citation.
Cliff, I have bit broader question. I understand your reluctance to call what appear to be weather changes in temperature and precipitation, a function of Global Warming, specifically on the local level as we've experienced this past year. And I also understand your position that what we saw this past year is a taste of what is come in another 50 years.
ReplyDeleteHowever, I am having trouble reconciling this with the current melting of Greenland ice, Alaskan Glaciers, our glaciers, the arctic, and Antarctica, along with the rising sea that is flooding islands in the South Pacific.
Could you please comment on this. If you already have, I apologize but would appreciate a citation.
RonK
ReplyDelete"However, I am having trouble reconciling this with the current melting of Greenland ice, Alaskan Glaciers, our glaciers, the arctic, and Antarctica, along with the rising sea that is flooding islands in the South Pacific."
Melting of Greenland Ice -- NASA satellite temperature measurements for the Arctic show zero or slightly cooling temp change for the past 13 years 10 months. Ground weather stations in Greenland show temperatures less than they were in the 1930s.
Alaskan glaciers -- Most Alaskan glaciers advance during the 1950-1977 cool period, then retreated during the 1978 to ~2000 warm period. Temperatures have been generally cooler the past decade and some glaciers are now beginning to advance.
Cascade glaciers, notably Mt. Baker and Mt. Rainer, advanced strongly during the 1950-1977 cool period, retreated during the 1980-~2000 warm period. NOAA temp data show cooling temperatures for the past decade and some glaciers have stopped retreating and advanced slightly from 2013-2015. For data, see http://wattsupwiththat.com/2015/09/13/mt-baker-glaciers-disappearing-a-response-to-the-seattle-times/
The Arctic -- see Greenland above.
The Antarctic -- NASA satellite temp measurements show zero or cooling temp trend in the Antarctic for the past 37 years (the total length of satellite temp measurements). The only ground weather stations at the South Pole show no warming at all since 1957. The Antarctic ice sheet is growing, not melting (avg annual temp in Antarctic is -58F)and sea ice is at all-time highs.
Rising sea level -- global sea level has been rising since 1850 at a rate of 7 inches per century (~3 1/2 inches per generation of 50 years). Analyses of NOAA tide gauges in the South Pacific and Indian Oceans show no sea level rise during their periods of record. Coastal erosion may be occurring, but it has nothing to do with rising sea level.
NASA satellite temperature records for the globe, north polar, south polar, Southern Hemisphere, tropics, US conterminous 49 states, and Australia all show no warming for anywhere from 18 to 37 years. You can check this out for yourself at
http://www.climatedepot.com/2015/12/17/satellites-show-no-global-warming-for-18-12-years-no-n-pole-warming-for-nearly-14-years-no-s-pole-warming-for-37-years/